Learning, Schooling, and Economic Growth: Revisiting a Classic Result
One of the most important results linking the economics of education to macroeconomics is that human capital—the skills embedded in a country's workforce—predicts economic outcomes, whether measured as the level of GDP or its rate of growth. But how does one measure human capital, and how does one build it?
For years, economists settled for years of schooling as their proxy for workforce skill. Countries with more education tend to be richer, and years of schooling predict both the level of GDP and subsequent growth. But years of schooling are a blunt measure: ten years in a strong school system is not the same as ten years in a weak one, so simply counting years can misrepresent how much skill a country's workforce actually has.
In work published in 2000, Eric Hanushek and Dennis Kimko set out to address exactly this measurement problem, an approach Hanushek and Ludger Woessmann later extended in 2008. Their key innovation was to measure learning itself, rather than time spent in school. Since directly testing the skills of the entire workforce isn't feasible, they used scores from international student assessments as a proxy, assembled across countries and time periods and put on a comparable scale, and related this measure of cognitive skills to long-run growth.
The results were striking: countries with higher test scores grew appreciably faster, and once test scores were included, the schooling-growth relationship shrank dramatically to “close to zero”. That was a big deal—it reframed how governments should think about investing in schools.
One rub
There's an awkward feature of the original analysis: the periods over which test scores and growth are measured overlap. The more recent Hanushek and Woessmann paper measures GDP growth from 1960–2000, but their test scores come from exams administered from 1964–2003. Much of the growth they're explaining happened before many of the scores were even observed—which opens the door to reverse causality. Maybe faster growth built better schools and produced higher scores, not the other way around. Hanushek and Woessmann do offer tests suggesting reverse causality isn't the main driver, but the concern isn't fully resolved.
More recently, Angrist, Djankov, Goldberg, and Patrinos (2021, Nature) extended this approach and built a global learning database drawing on test scores from 2000–2017. They confirmed that learning-adjusted human capital tracks growth more closely than schooling alone—but their growth regression measures growth over 2000–2010 while the learning measure averages scores from 2000 onward, so the periods still overlap.
So the question remains: with more data now available, can we separate learning and growth more cleanly? And do these relationships even hold up 24 years later?
Looking forward from 2000
To find out, I combined math and science scores from TIMSS 1999 and PISA 2000 into a standardized measure, linked it to World Bank GDP-per-capita data, and tracked economic growth through 2024. Test scores are measured in 1999–2000, while the subsequent growth years run from 2001 through 2024. I also use Barro-Lee schooling data from 2000, controlling for initial GDP per capita. The sample is 48 countries.
So what do I find?
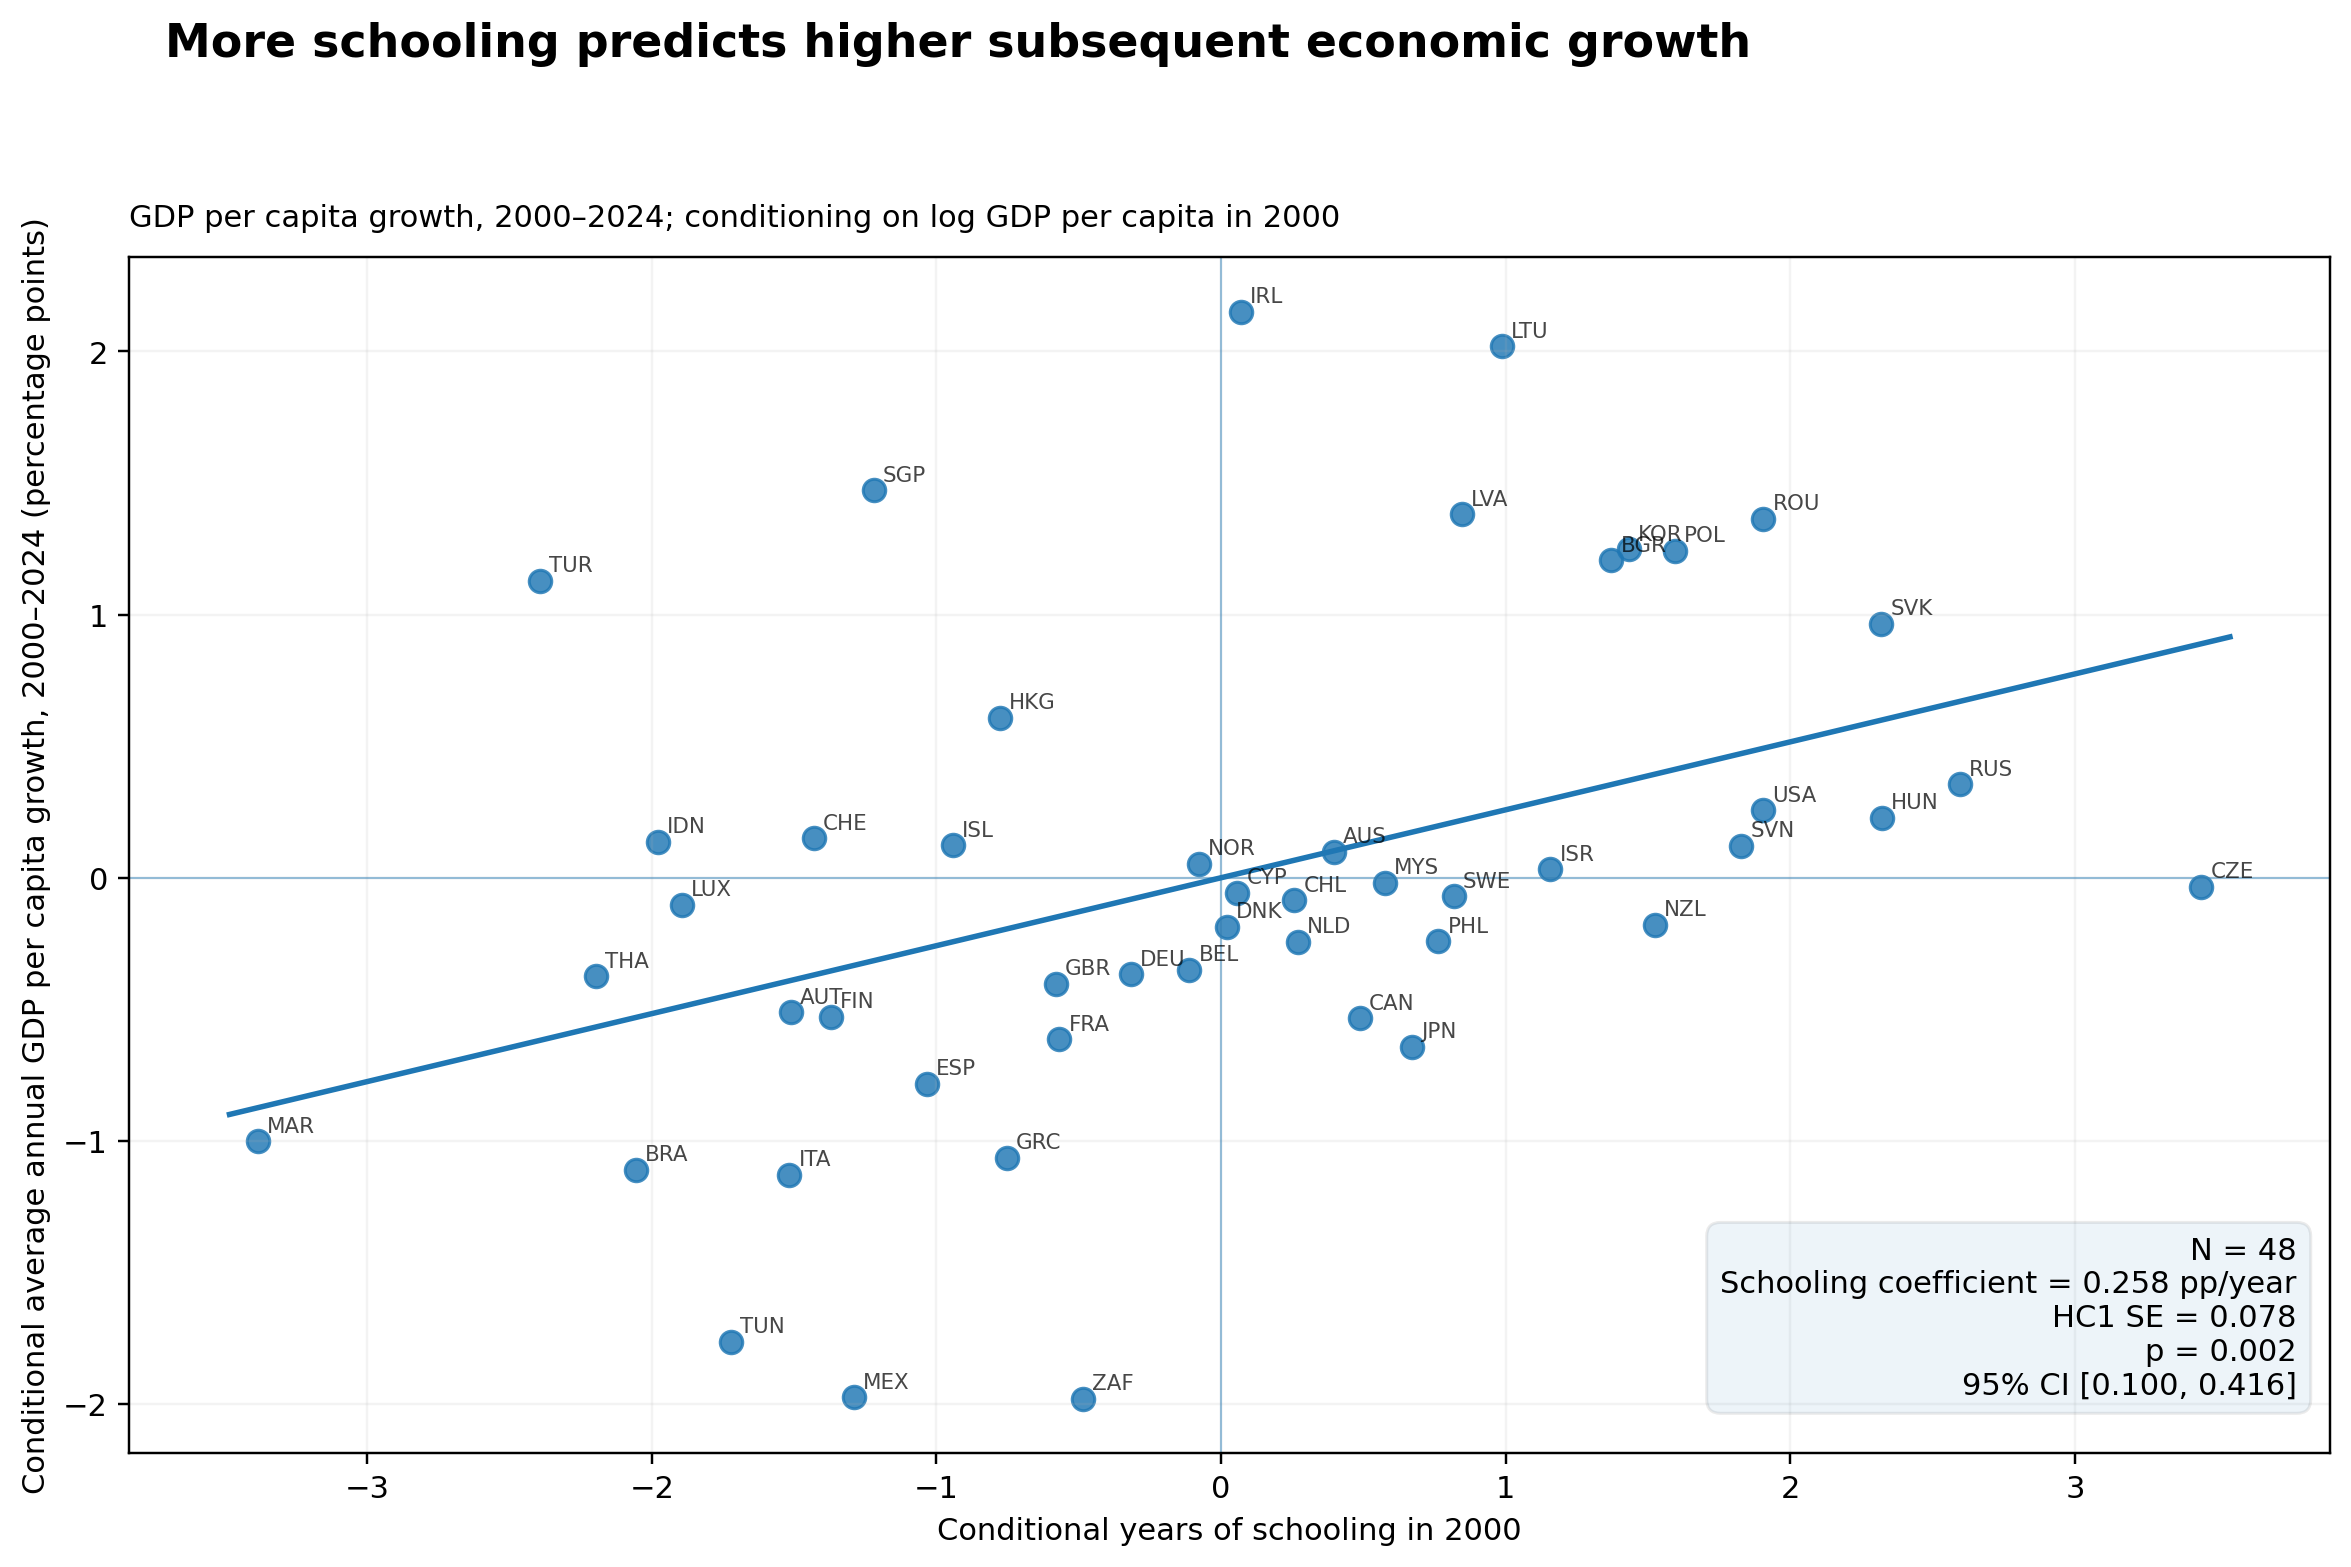
First, the traditional result holds up. More years of schooling in 2000 predicts higher subsequent growth, conditional on initial GDP. One additional year of schooling predicts about 0.26 percentage points more annual growth (p = 0.002) (Figure 1).
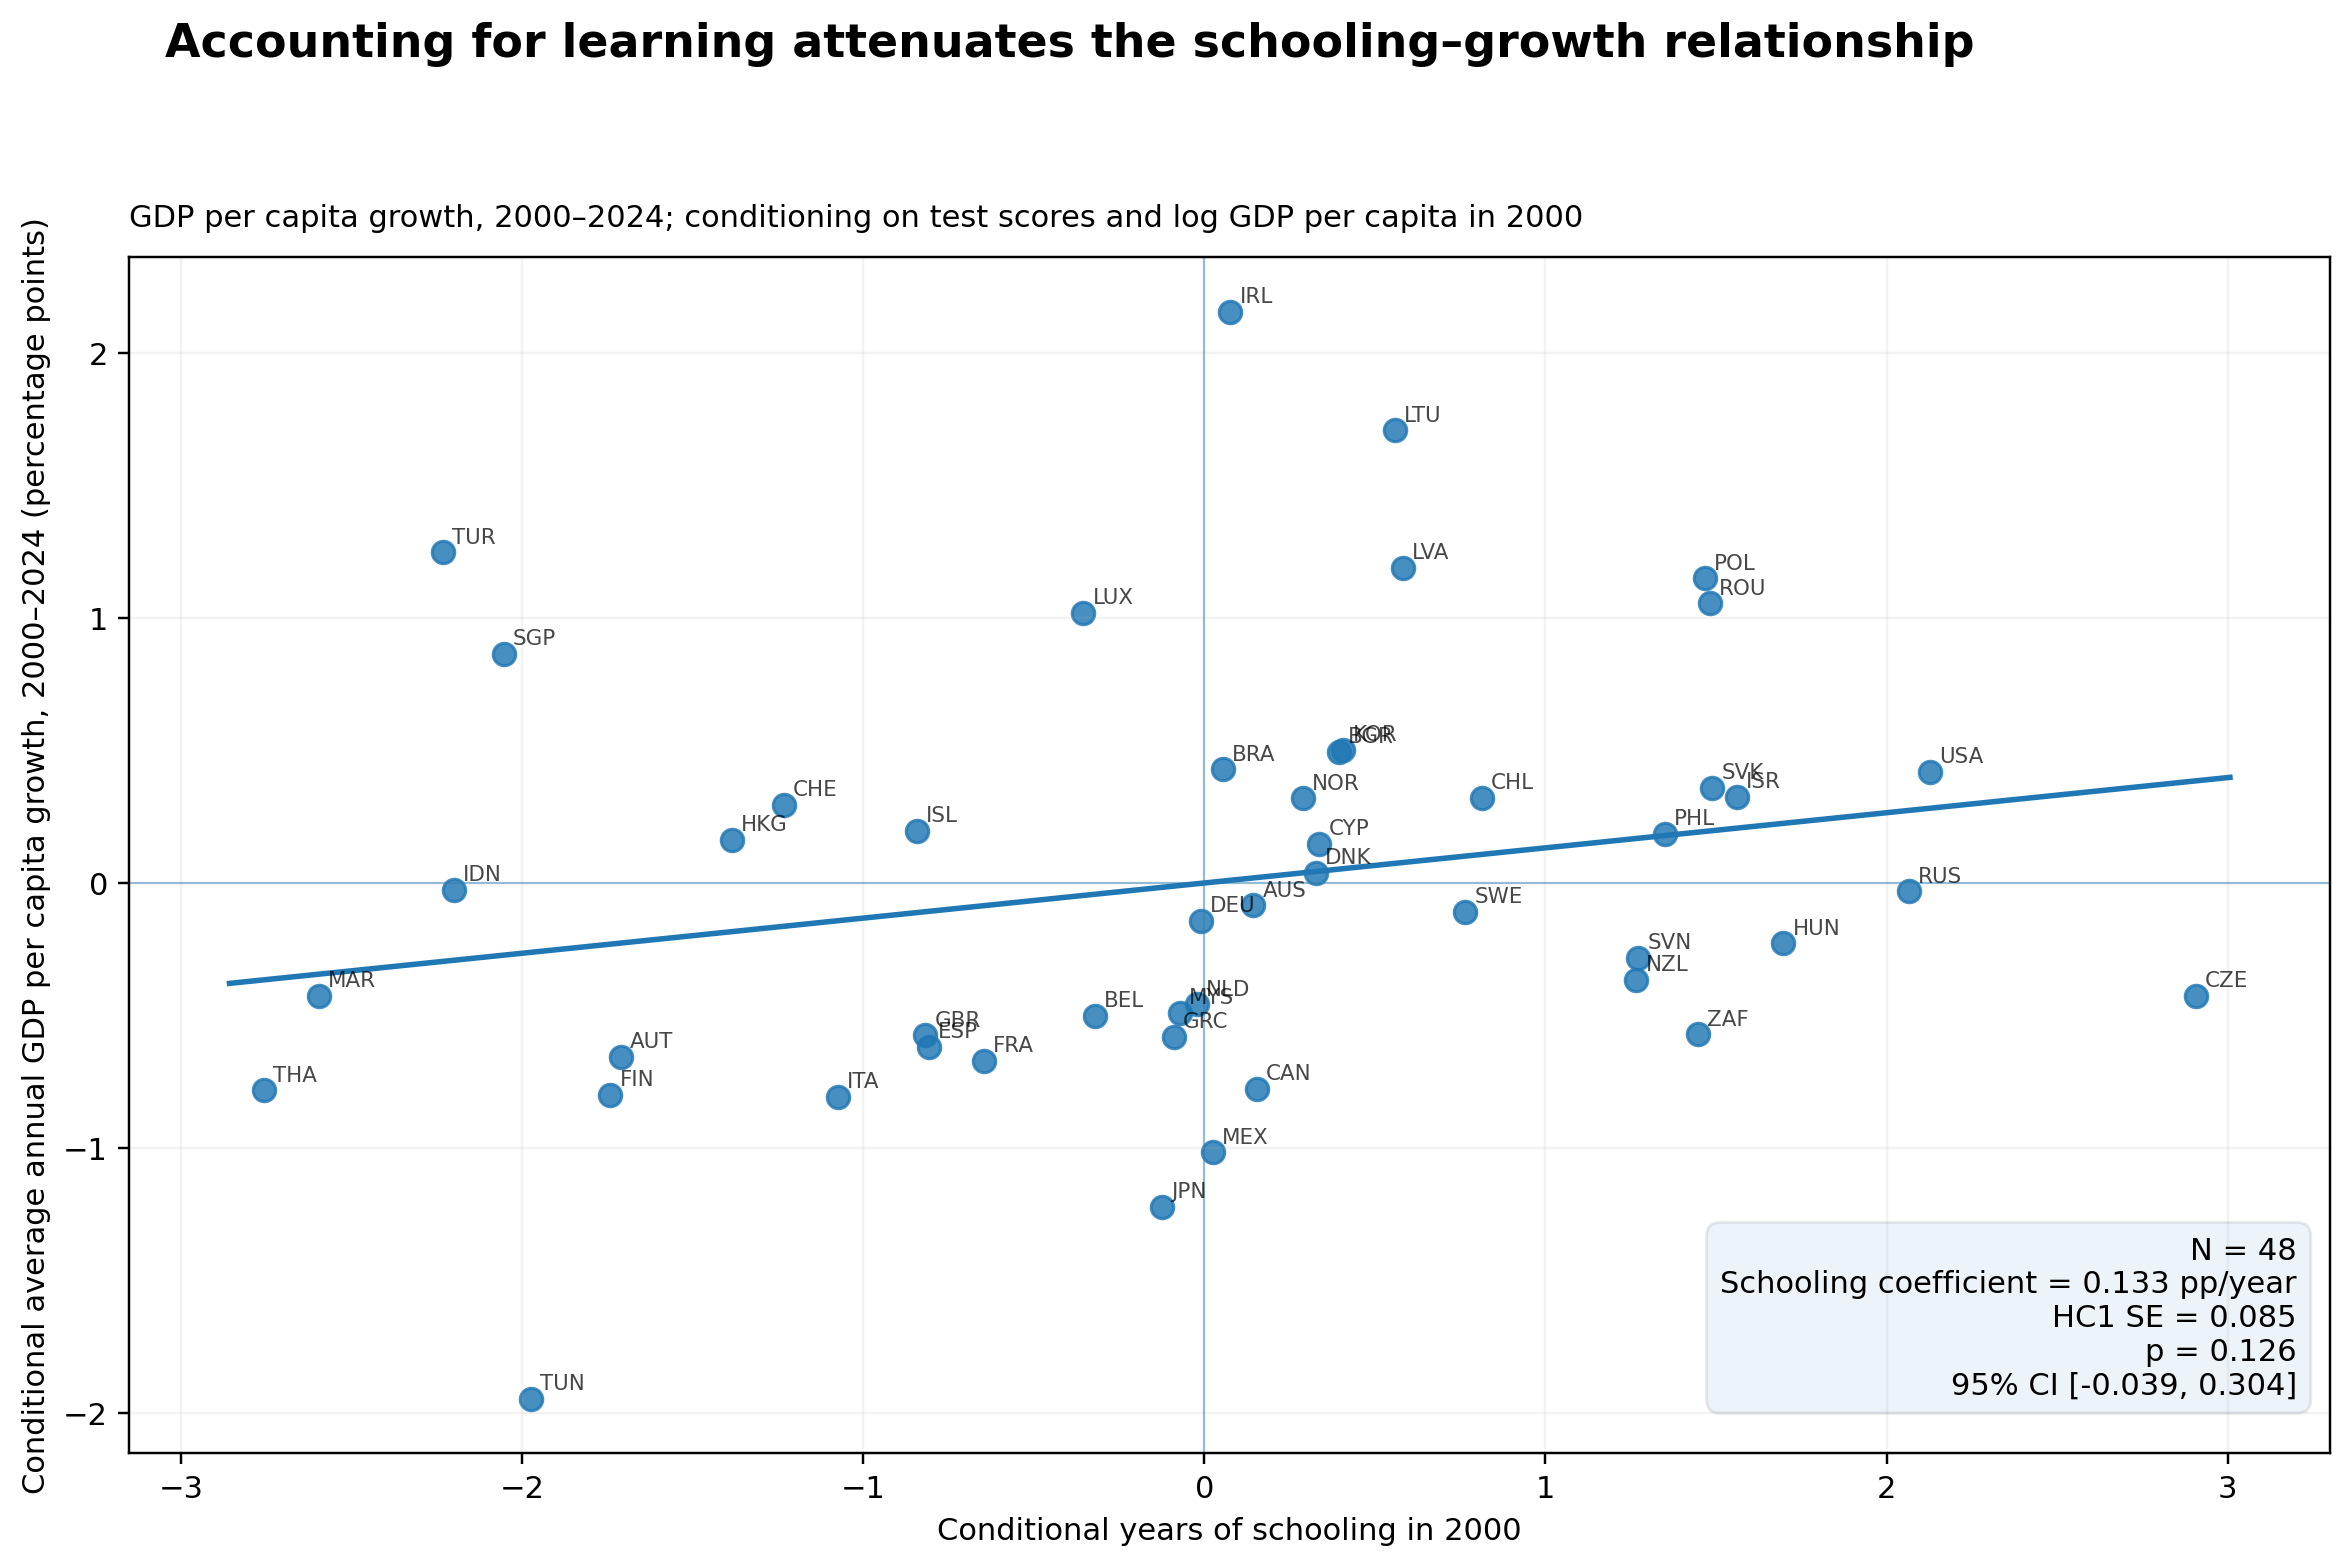
However, adding test scores cuts that schooling coefficient roughly in half, to 0.13 percentage points (p = 0.126) (Figure 2)—reproducing the core Hanushek-Woessmann finding that learning explains much of why schooling matters.
But my result is less stark than theirs because the schooling coefficient doesn't fall to zero. It's no longer statistically significant, but that does not mean that there isn't a relationship. In my estimates, the schooling coefficient falls by about half, compared with more than 90 percent in the original analysis. One possibility is that the cleaner timing eliminates some of the bias arising from the overlap between growth and testing years that pushed the schooling estimate toward zero in the earlier analysis. With the cleaner approach, the relationship remains positive and economically meaningful, consistent with years of schooling capturing dimensions of human capital beyond what math and science tests measure.
So what about test scores, the cleaner measure of learning?
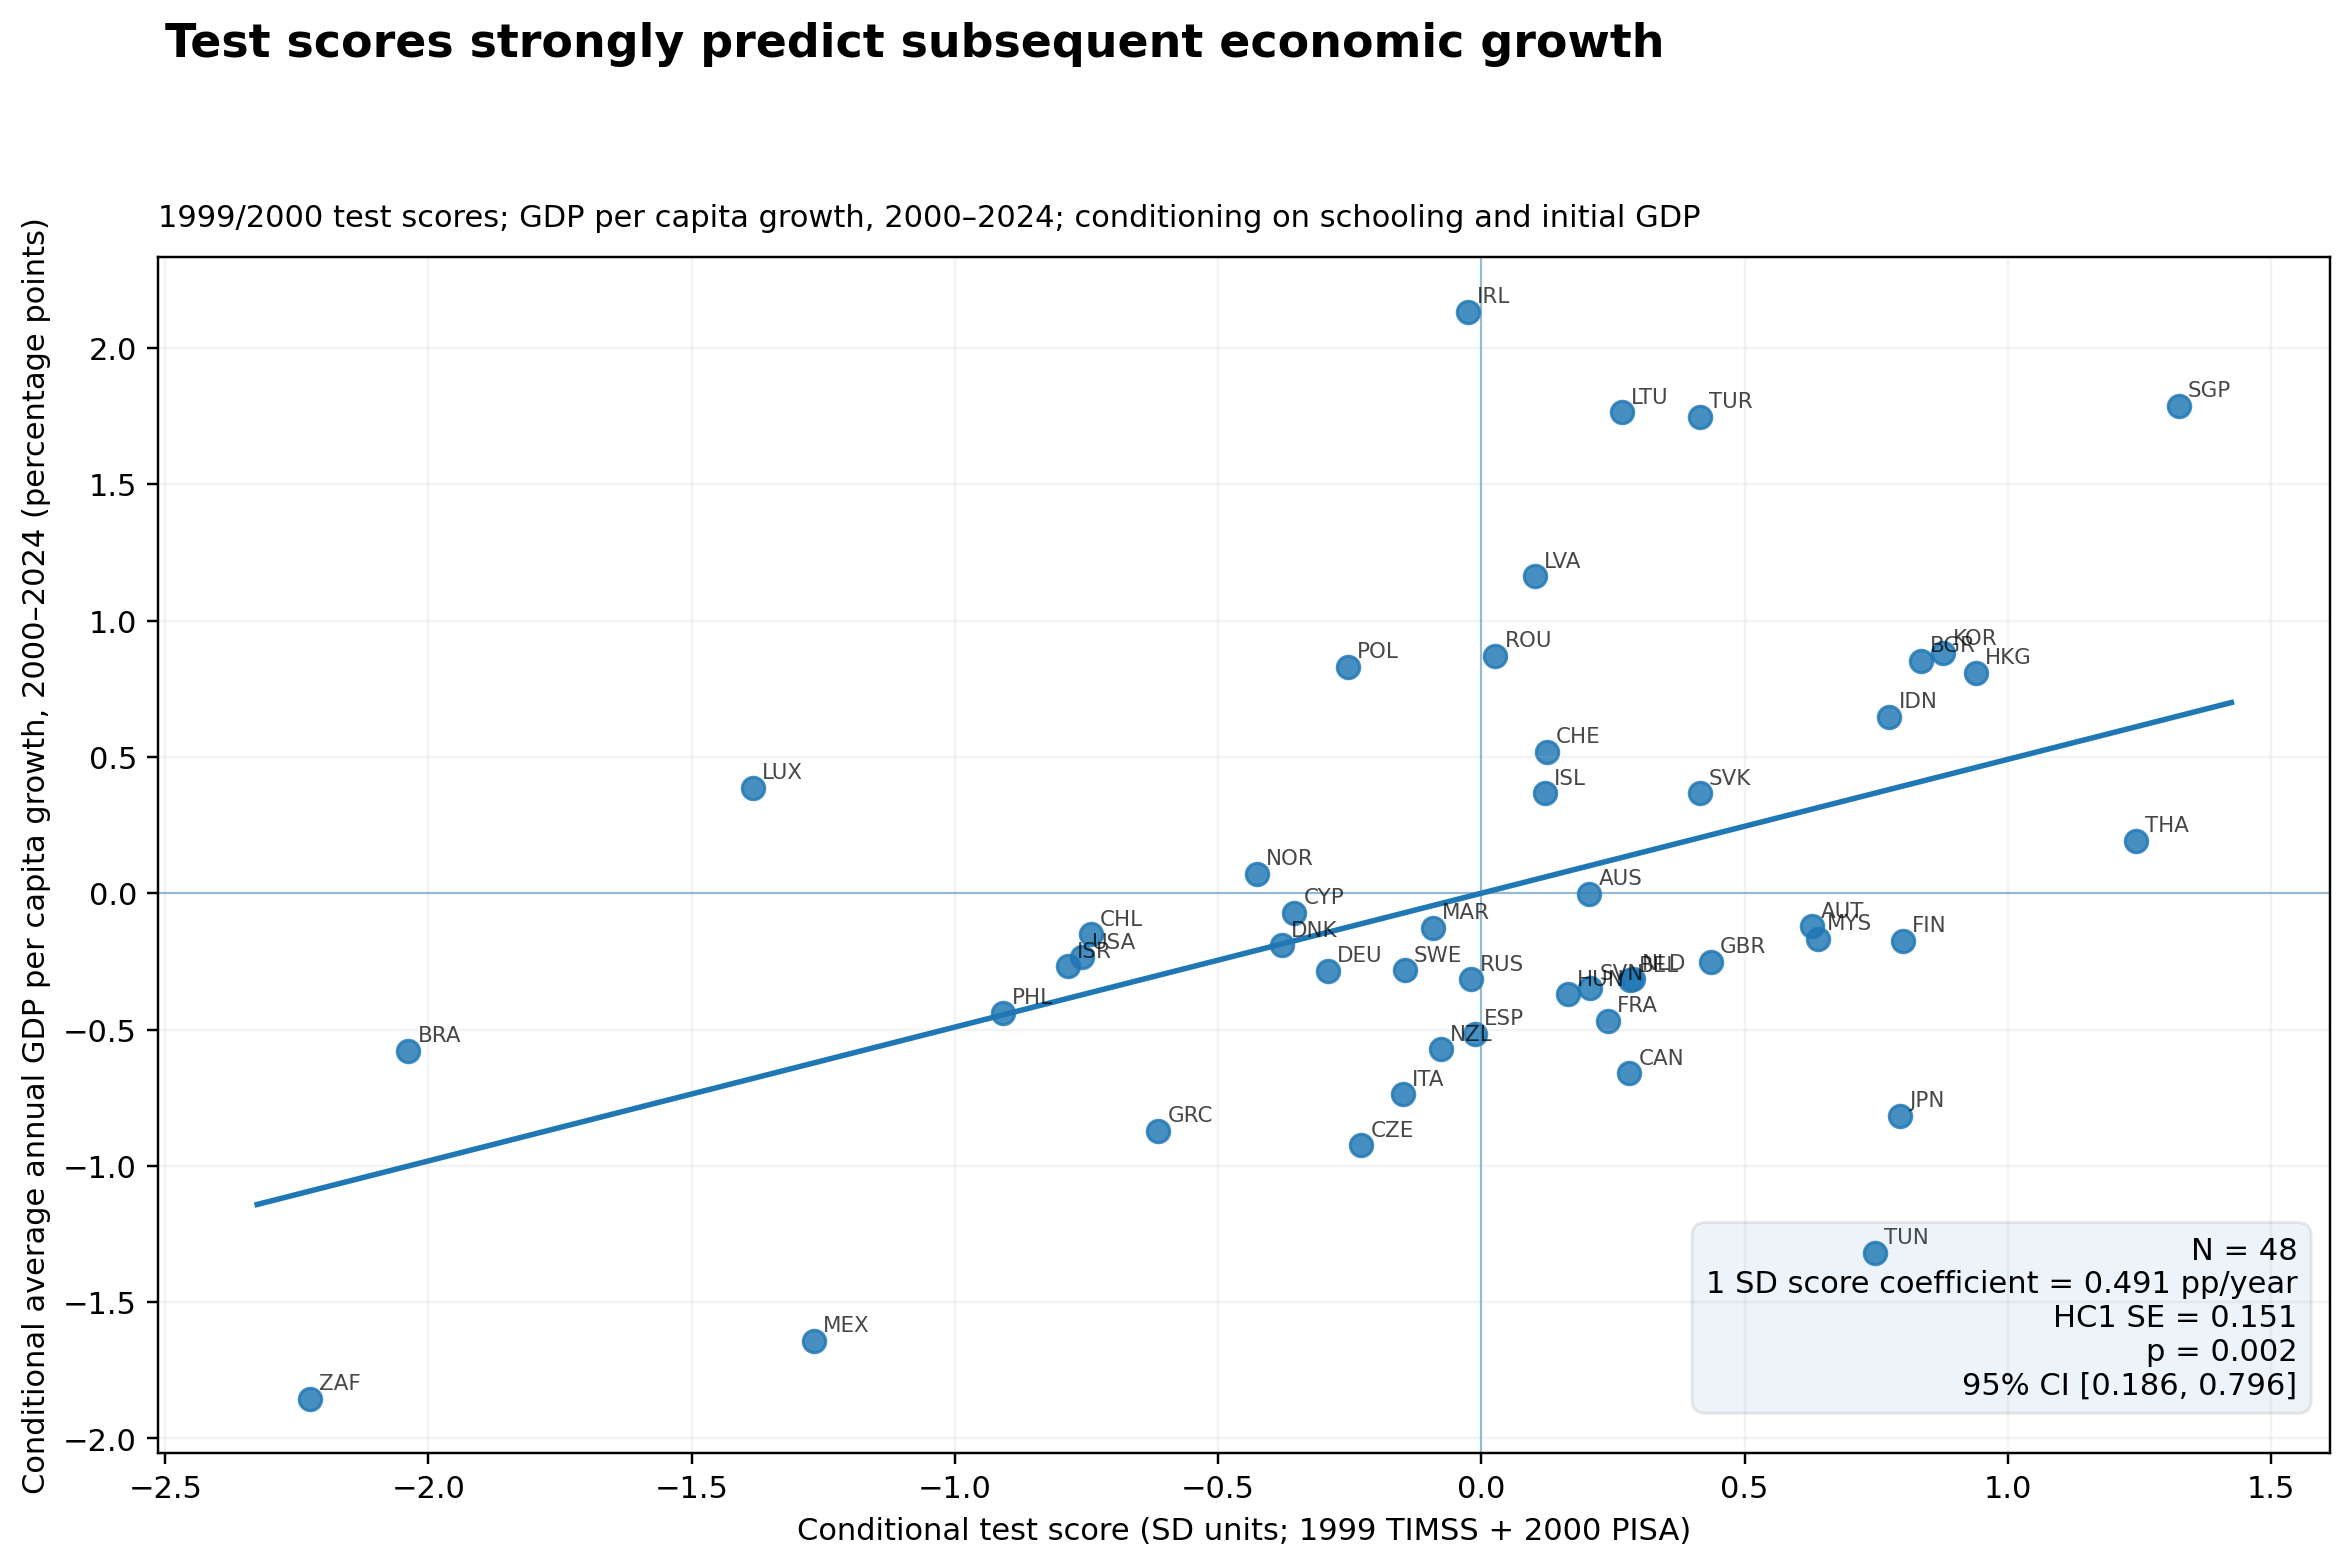
The relationship is large. A one-standard-deviation difference in test scores predicts about half a percentage point more annual growth (p = 0.002) (Figure 3)—roughly 26% of the sample's average growth rate of 1.89%. And this time there is zero overlap between the years in which test scores are measured and the years over which GDP growth is measured.
Does the classic result hold up?
Yes, with a qualification.
Learning still strongly predicts subsequent growth, and controlling for it substantially reduces the estimated importance of years of schooling. But schooling's independent role doesn't vanish entirely. The evidence suggests that both attainment and learning may matter.
None of this establishes causality. But it is nonetheless important to know whether the key patterns in the data are robust to the most obvious concern about reverse causality, and whether these relationships persist through 2024—several years beyond the periods examined in previous analyses.
They do.
The lesson isn't to choose between getting kids to stay in school and improving what they learn while they're there. Both appear to matter—but what students actually learn matters a lot.
References
Angrist, Noam, Simeon Djankov, Pinelopi K. Goldberg, and Harry A. Patrinos. 2021. “Measuring Human Capital Using Global Learning Data.” Nature 592: 403–408. https://doi.org/10.1038/s41586-021-03323-7.
Barro, Robert J., and Jong-Wha Lee. 2013. “A New Data Set of Educational Attainment in the World, 1950–2010.” Journal of Development Economics 104: 184–198. https://doi.org/10.1016/j.jdeveco.2012.10.001.
Hanushek, Eric A., and Dennis D. Kimko. 2000. “Schooling, Labor-Force Quality, and the Growth of Nations.” American Economic Review 90 (5): 1184–1208. https://doi.org/10.1257/aer.90.5.1184.
Hanushek, Eric A., and Ludger Woessmann. 2008. “The Role of Cognitive Skills in Economic Development.” Journal of Economic Literature 46 (3): 607–668. https://doi.org/10.1257/jel.46.3.607.
Replication code
Download the Python code used for this analysis →
The script contains the historical test-score inputs, downloads the World Bank and Barro-Lee data used here, estimates the specifications reported in the post, and reproduces all three figures.